Explain what
changed.
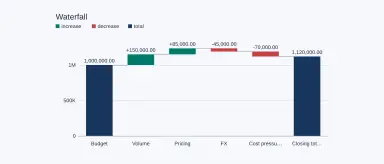
Connect an opening balance to a closing total. Show which movements contributed to the result and how performance compares with a target.
CUSTOM ELEMENTS FOR SAP WEB INTELLIGENCE
Bring a new perspective to your WebI reports. Advanced visuals that turn complex data into clear, useful stories.
Your reports. Your dimensions and measures.
A whole new way to see them.

Built for the reports
you already work with.
THE VISUAL COLLECTION
Explore 19 components, from everyday KPIs to deeper analysis. Select a visual to see its views, data inputs and live preview.
No visuals match your search. Try a different name or category.
Previews use illustrative data. Component renderers are available; production compatibility is confirmed during your environment evaluation.
FROM CHARTS TO ANSWERS
Start with a business question. Choose the visual that makes the answer easier to see.
Connect an opening balance to a closing total. Show which movements contributed to the result and how performance compares with a target.
Compare planned and actual timelines. Put project activity and resource allocation in view, then investigate delays.

Compare distributions, spot unusual observations and monitor process variation. Give exceptions the attention they deserve.

Sales pipelines · Executive scorecards · Organizational structures · Category performance
WHY eGOPI VISUALS
Keep the reporting workflow your team knows. Add specialist ways to explore and communicate the data inside it.
See how it fits ↓Bring distributions, timelines and process analysis alongside your everyday KPIs.
Combine charts with labels, panels, icons and compact signals for a clearer reporting experience.
Switch supported display modes to find the view that best explains your data.
Use a guided trial to check your report, data mapping, WebI patch and required export workflows.
HOW IT WORKS
Custom Elements are additional visual components delivered through a service registered in SAP BusinessObjects.
Find the chart that answers your business question. Preview it with sample data first.
Your BI administrator registers the Custom Elements service in CMC and confirms access and licensing.
Insert the element, assign dimensions and measures, then configure the available display options.
Check interaction, rendering and exports in your environment before rolling out to your users.
The current advanced release targets SAP BusinessObjects BI 2025. Validation in specific BI patches is pending, including CMC insertion, HTML sandbox behavior, native input controls, scheduled PDF/Excel output and printing. If you use WebI 4.3, request a compatibility review before subscribing.
HTML and PNG renderers are available. Interactive filters are local to the visual; they are not replacements for native report-wide input controls. Saved settings are used for static exports. Your BI team should review service connectivity and data handling as part of the trial.
Read the setup guide →TRIALS & SUBSCRIPTIONS
Explore with a 30-day trial, then choose a plan for your reporting team.
STARTER
For smaller reporting teams.
Proposed launch pricing
PROFESSIONAL
For BI developers and reporting teams.
Proposed launch pricing
BUSINESS
For multiple BI environments.
Proposed launch pricing
Prices are proposed launch rates in CAD. Annual totals are billed yearly. Final component entitlement, taxes, subscription terms and trial eligibility are confirmed with your enquiry. No payment is taken on this page.
GOOD QUESTIONS
A library of Custom Elements for SAP Web Intelligence: visual components you insert into reports and bind to dimensions and measures. This is an independent add-on from eGopi Solutions Inc.
You continue authoring reports in WebI and assign report data to the custom element. The element renders through its configured service. Review data flows and service access with your BI administrator before using production data.
Yes—request a 30-day evaluation and tell us your SAP version, target visual and reporting goal. We will confirm fit, eligibility and the setup needed. No credit card is required to request a trial.
These images come from the existing component renderers and use illustrative datasets. Each visual includes a link to its live technical preview so you can inspect it before requesting a trial.
HTML and PNG renderers are available. PDF, Excel, printing and scheduled output must be tested on your particular BI patch and workflow during evaluation; universal export compatibility is not yet confirmed.
The current offer is the visual component library. Distributable WebI dashboard templates are planned for a future release and are not included as a current feature.
LET YOUR DATA DO THE TALKING
Tell us what you want to improve. We’ll help you choose a visual and plan your 30-day evaluation.